Note
Click here to download the full example code
Zoom layer
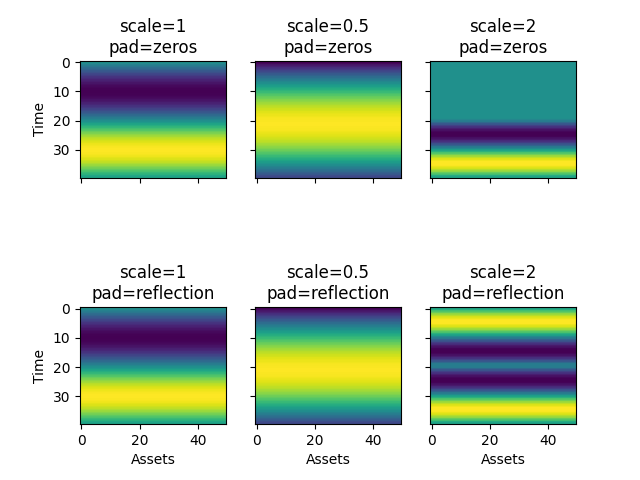
The Zoom layer is inspired by the Spatial Transformer Network [Jaderberg2015]. Its goal is to be able to zoom in and zoom out across the time dimension. In other words, it performs dynamic time warping. Note that this warping is identical over all assets and channels. In the example below, we show how one can use this layer to both speed up and slow down the original input tensor x.
Specifically, let us assume that we have 50 assets that have identical returns that follow a sinusoid. The period of this sinusoid is equal to our lookback which is 40 (i.e. hours).
The first column shows the original input tensor. The second column shows a slow down (scale = 0.5).
Here we only look at the previous 20 hours, however, we stretch each hour to last two hours.
Finally, the third column shows a speed up (scale = 2). Each hour is shrunk to last 30 minutes.
Note that in the case of speed up the padding_mode becomes important since we do not
have access to what happened more than 40 hours ago.
Note
This layer does not modify the shape of the input.
As with many other layers in deepdow one can either learn one scale for the entire
training set or have a separate network that predicts a different one for each sample.
from deepdow.data.synthetic import sin_single
from deepdow.layers import Zoom
import matplotlib.pyplot as plt
import numpy as np
import torch

np.random.seed(3)
torch.manual_seed(3)

lookback, n_assets = 40, 50
scale_grid = [1, 0.5, 2]
padding_grid = ['zeros', 'reflection']

dtype = torch.float

x = torch.as_tensor(np.stack(n_assets * [-sin_single(lookback, freq=1 / lookback)],
                             axis=1),
                    dtype=dtype)

x = x[None, None, ...]  # add sample and channel dimension

fig, axs = plt.subplots(len(padding_grid), len(scale_grid), sharex=True, sharey=True)

for r, padding_mode in enumerate(padding_grid):
    for c, scale in enumerate(scale_grid):
        layer = Zoom(padding_mode=padding_mode)
        x_out = layer(x, torch.ones(1) * scale)

        axs[r, c].imshow(x_out.numpy()[0, 0])
        axs[r, c].set_title('scale={}\npad={}'.format(scale, padding_mode))

plt.setp(axs[-1, :], xlabel='Assets')
plt.setp(axs[:, 0], ylabel='Time')
fig.subplots_adjust(hspace=1)
Total running time of the script: ( 0 minutes 0.305 seconds)